Life and Work: Who Did What at the Turn of the 20th Century?
Historical Essay
by William Issel and Robert Cherny
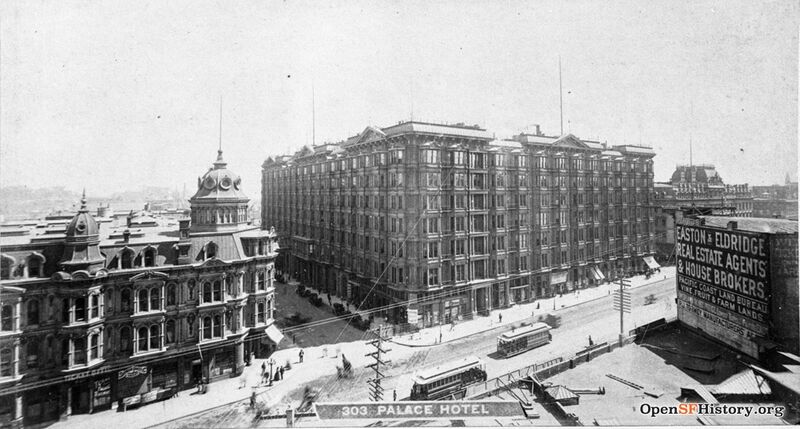
Market Street cable cars running down the "slot" between the north and south halves of 1885 San Francisco.
Photo: OpenSFHistory.org wnp37.00237
The Slot was an iron crack that ran along the center of Market Street, and from the Slot arose the burr of the ceaseless, endless cable that was hitched at will to the cars it dragged up and down. In truth, there were two Slots, but in the quick grammar of the West time was saved by calling them and much more that they stood for, “The Slot.” North of the Slot were, the theatres, hotels, and shopping district, the banks and the staid, respectable business houses. South of the Slot were the factories, slums, laundries, machineshops, boiler works, and the abodes of the working class.
So wrote Jack London a short time after the earthquake and fire storm that leveled both sides of the Slot. London added, rather unnecessarily, that “the Slot was the metaphor that expressed the class cleavage of Society.”(1)
London’s description etches a division sharper than it was in fact. Nonetheless, the neighborhoods of the city were indeed differentiated by both class and ethnicity. Throughout the latter half of the nineteenth century and the early twentieth century, the lives of many San Franciscans shaped themselves along the two dimensions of work and residence. The concepts of work, family, and neighborhood were closely related for large numbers of San Franciscans, and separation of these concepts for the purposes of analysis must be accompanied always by the realization that the complex whole involved patterns of interaction that made it more than just the sum of the parts.
Work
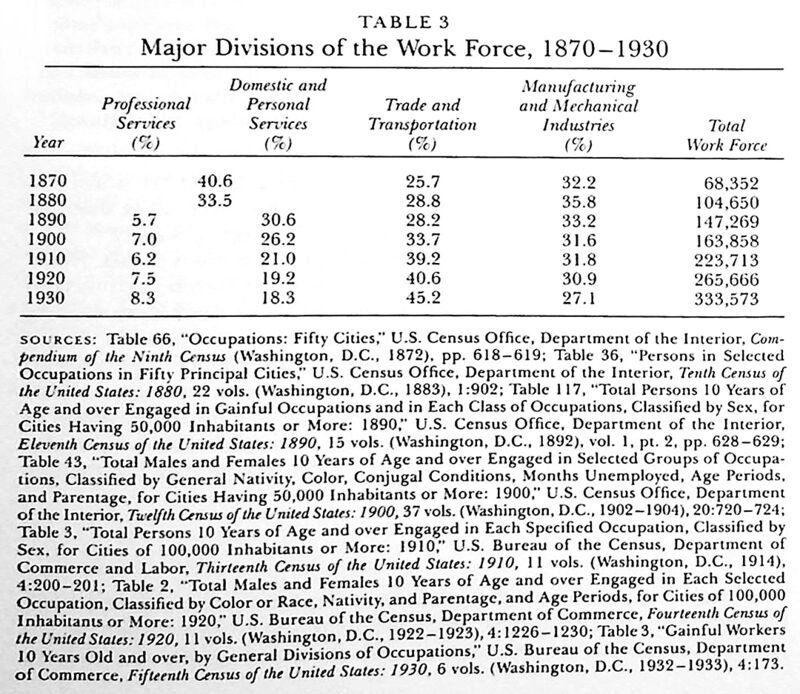
The nature and location of work in San Francisco from the mid-1860s through the early 1930s show a high degree of consistency despite the 388 percent increase in the size of the work force and despite the virtually complete destruction of the built environment midway through the period in 1906. Table 3 summarizes major divisions of the work force over time and illustrates long-term patterns of change. During the six decades, the professional sector and the trade and transportation sector slowly increased their proportions of the work force, and both the manufacturing and the service sectors slowly decreased. These changes must be clearly understood as changes in proportions. The number of workers in all sectors increased, albeit more rapidly in some than in others.
In 1890, San Francisco ranked eighth in the nation in total size. Of the fifteen largest cities, only Washington had a larger proportion of its work force in the professional sector. Only two cities had a smaller proportion of their work forces in manufacturing—New Orleans and Washington. Each of the other twelve cities had more than 35 percent of its work force in manufacturing, ranging from 35.3 percent for Boston to 47 percent for Philadelphia. No other city had a more even balance than San Francisco among the three largest economic sectors of domestic and personal service, trade and transportation, and manufacturing and mechanical industries.(2)
San Francisco’s position both as chief entrepot for the Pacific Coast and as the center for a coasting trade extending from Panama to Alaska explains why trade and transportation held such a large proportion of the city’s work force. Its position as financial and corporate capital of the West explains other unique features of the city’s occupational structure. In 1890, San Francisco had more lawyers than cities half again its size and more proportionately than Boston or New York. In 1910, clerical jobs claimed one of every ten San Franciscans with an occupation. These patterns persisted throughout the 1920s. There was one banker or broker for every ninety-one employed males in 1930, and one-sixth of all employed San Franciscans filled clerical positions that year.(3)
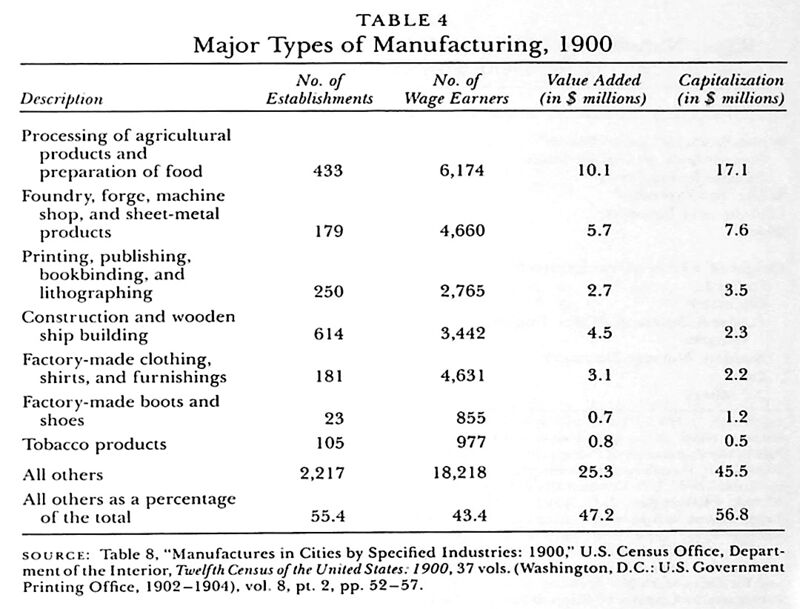
San Francisco never became a major manufacturing center on the order of Pittsburgh or Detroit, either in terms of dominating the national production of one or more items or in terms of the manufacturing sector dominating the economy of the city. Nonetheless, from the 1860s to the 1930s, a substantial part of the work force engaged in manufacturing. Table 4 summarizes data for the largest components of the manufacturing sector in 1900.(4)
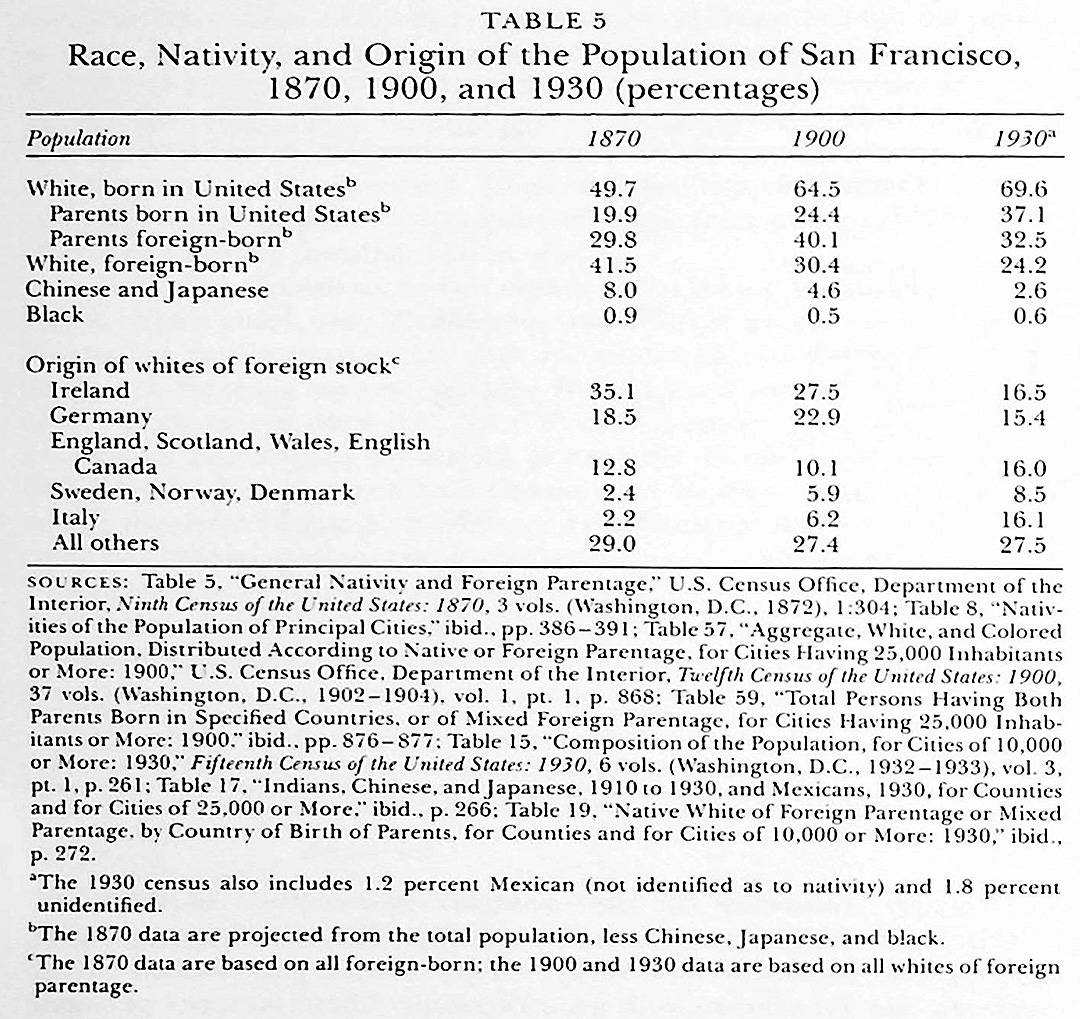
Just as the city’s economy was diversified, so too were its people ethnically heterogeneous. Table 5 summarizes census data on race, nativity, and origin for 1870, 1900, and 1930. Throughout this period, those of foreign parentage constituted well over half the city’s population, and at times more than 70 percent. The Irish arrived among the first during the gold rush and remained numerically dominant throughout the nineteenth century Germans, including Protestants, Catholics, and Jews, stood next in numbers throughout the nineteenth and early twentieth centuries. Scandinavians and Italians were comparative latecomers, arriving in significant numbers only late in the nineteenth century. Most San Franciscans were white, especially after the 1890s when the Chinese population of the city declined by about half.
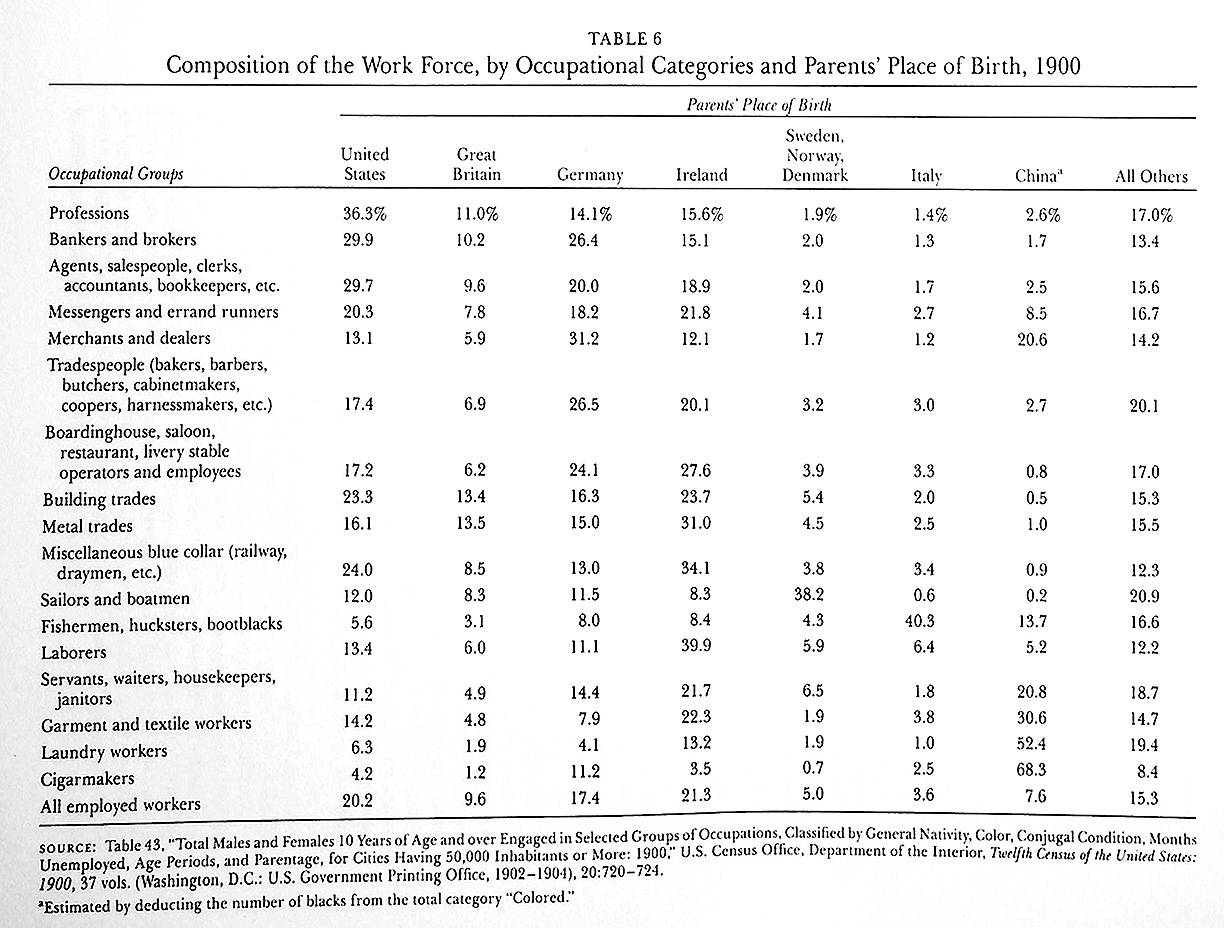
Many occupations were ethnically distinctive. Table 6 summarizes data for 1900. Although some occupations were disproportionately of one group, none was totally restricted, and only a few stand out as having great disproportion. Ethnic patterns within occupations usually represent tendencies rather than majorities. Thus, the Irish were found in disproportionate numbers in the building trades (including 54 percent of plasterers, 44 percent of roofers, 43 percent of masons, and 33 percent of plumbers), the metal trades (40 percent of blacksmiths, 38 percent of iron and steel workers), various transportation-related jobs (including 36 percent of teamsters), and day laborers (43 percent). Thirty percent of all employed women were Irish, including 30 percent of female teachers, a third of all female merchants, 40 percent of all female laborers, 31 percent of female servants, and 37 percent of female laundry workers. Germans were more likely than the Irish to be merchants, shopkeepers, or artisans. Half the city’s cabinet-makers were German, and Germans made up 40 to 50 percent of watchmakers and clockmakers and repairers, bakers, and butchers. Eighty percent of all workers in beer brewing were German. German women were far less prominent in the work force than were Irish women; only 15 percent of the female work force were German, and they were concentrated in mercantile and other white-collar occupations.(5)
Neighborhoods
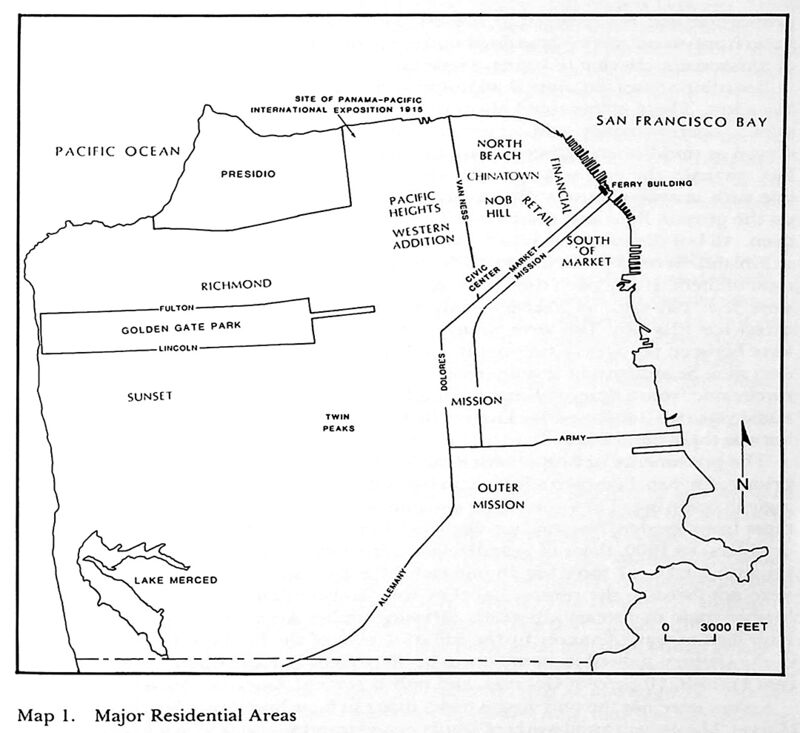
San Francisco s residential areas differed from one another in ethnicity, sex, marital status, occupations, and income. Seven distinct neighborhoods may be discerned in San Francisco from the mid-1870s through World War I:
- 1. South of Market: an area with many single men. often young, often in jobs requiring few skills, often living in boardinghouses; but also including families, especially before 1906, usually tenants, with family heads typically in unskilled or semiskilled occupations
- 2. Mission District: an area of family units and home ownership, with family heads often skilled workers or small-scale entrepreneurs
- 3. Western Addition and nearby areas: unquestionably middle-class, often upper middle-class, based on family units and home ownership, with family heads often merchants or professionals
- 4. Nob Hill—Pacific Heights: distinctly upper-class
- 5. Chinatown: Chinese, with many single males, poorly paid, segregrated both residentially and occupationally, an area in many ways virtually autonomous
- 6. North Beach: predominantly Italian after about 1900, family-oriented but with many young single males; largely working-class, but with a significant number of Italian businessmen and professionals
- 7. Downtown: including waterfront workers, clerical workers, merchants, and professionals living in apartments and hotels; also a vice district
By the mid-1880s, and in some cases ten years earlier, the basic characteristics of each of these areas had become clear. Throughout the 1890s and early twentieth century, few changes occurred in these patterns; indeed, some neighborhoods became more homogeneous in the early twentieth century. After 1900, new neighborhoods developed in the Sunset and Richmond districts as families followed the streetcar lines into what had shortly before been sand dunes along either side of Golden Gate Park. Map 1 indicates the approximate boundaries of these major geographic areas.
Notes
1. Jack London, “South of the Slot,” in Moon-Face and Other Stories (New York, 1919), p. 34.
2. Table 117, “Total Persons 10 Years of Age and over Engaged in Gainful Occupations and in Each Class of Occupations, Classified by Sex, for Cities Having 50,000 Inhabitants or More: 1890,” U.S. Census Office, Department of the Interior, Eleventh Census of the United States: 1890, 15 vols. (Washington, D.C., 1892), vol. 1, pt. 2, pp. 628-629.
3. Table 1 18. “Total Males and Females 10 Years of Age and over Engaged in Selected Occupations, Classified by General Nativity, Color, Age Periods, Conjugal Conditions, Illiteracy, Inability to Speak English, Months Unemployed, and Country of Birth, for Cities Having 50,000 Inhabitants or More: 1890,” ibid., pp. 636-639, 702–703, 704–705, 728–729; Table 3, “Total Persons 10 Years of Age and over Engaged in Each Specified Occupation, Classified by Sex, for Cities of 100,000 Inhabitants or More: 1910,” U.S. Bureau of the Census, Department of Commerce and Labor, Thirteenth Census of the United States: 1910, 11 vols. (Washington, D.C., 1914), 4:200 — 201; Table 3, “Gainful Workers 10 Years Old and over, by General Divisions of Occupations,” U.S. Bureau of the Census, Department of Commerce, Fifteenth Census of the United States: 1930, 6 vols. (Washington, D.C., 1932 — 1933), 4:173.
4. For an argument that San Francisco was in fact a major manufacturing center, see Shumsky, “Tar Flat and Nob Hill,” pp. 20–64. Being a “manufacturing city” implies some sort of comparative dimension, however, and a comparative analysis shows clearly that the city’s economy was never dominated by manufacturing and that manufacturing in the city never dominated production of any particular item. The city unquestionably had manufacturing. It was not a manufacturing city in the pattern of Pittsburgh, Lawrence, or Detroit.
5. Table 43, “Total Males and Females 10 Years of Age and over Engaged in Selected Groups of Occupations, Classified by General Nativity, Color, Conjugal Conditions, Months Unemployed, Age Periods, and Parentage, for Cities Having 50,000 Inhabitants or More: 1900,” U.S. Census Office, Department of the Interior, Twelfth Census of the United States: 1900, 37 vols. (Washington, D.C., 1902–1904), 20:720-724.
Excerpted from San Francisco 1865-1932, Chapter 3 “Life and Work”

